Sensor Forensics Lab

v1.0

Sensor Forensics Lab

The GIMBAL, GOFAST and "Tic Tac" Navy videos, rebuilt frame by frame. Every number on the screen read and checked, the jet's turn and the camera's line of sight reconstructed, and six explanations scored against the footage and the aircrew's testimony with the same geometry and the same math.

It tests hypotheses. It does not set out to confirm any belief, and where the public data cannot decide, it says so and names the one measurement that would.

Open the lab Source on GitHub See my other projects

Free, in the browser. Best on a desktop screen in Chrome or Edge; the lab streams the footage frame by frame as you play it.

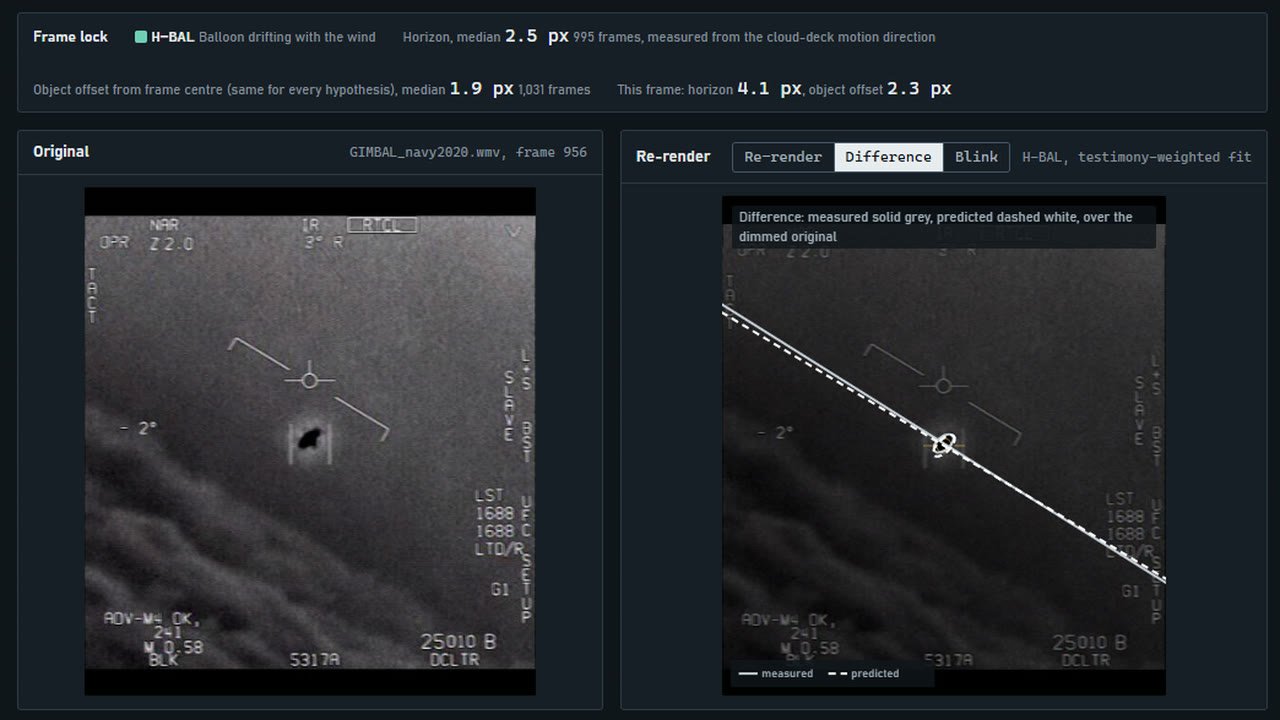
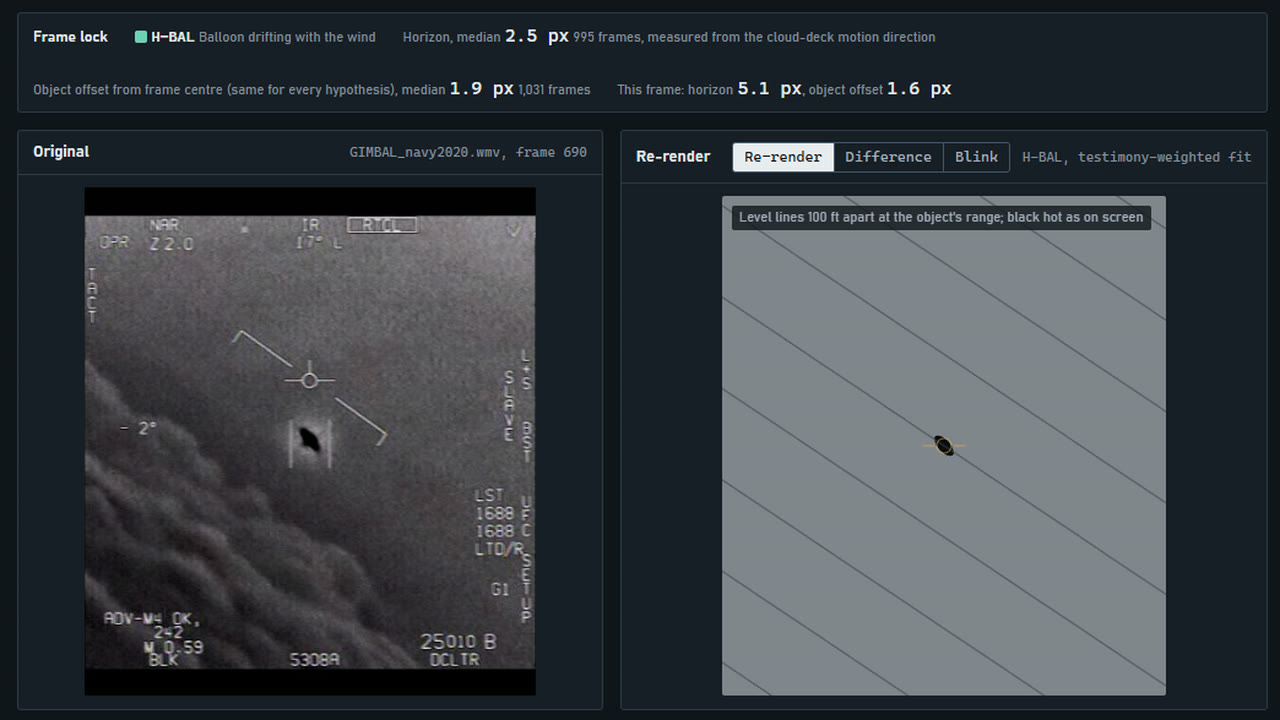
GIMBAL, the last 11 seconds: the Navy footage (left) beside the re-render of one explanation (right), locked frame by frame.

Three short infrared videos, recorded by Navy fighter crews in 2004 and 2015 and officially released in 2020, are the most argued-over footage of unidentified objects there is. Most analyses of them pick an answer and defend it. This lab puts every candidate through one pipeline instead: the same reconstructed geometry, the same physics, the same evidence from the frames and the same scoring, and then asks which one the data actually favours, by how much, and what could change its mind.

Six explanations, one scorer

  1. H-BALA balloon drifting with the wind
  2. H-SLOWA slow flier: a bird or small drone
  3. H-ACA distant aircraft, its engine exhaust seen as glare
  4. H-ARTGlare in the pod's own optics, on a target of any kind
  5. H-CLOSEA small object close to the jet
  6. H-WITAn object on a free path, with no physical model at all

No explanation gets its own rules. A test scans the scoring code and fails if anything in it branches on an explanation's name, and renaming or reordering the six changes no score.

The Cockpit view: the original GIMBAL frame beside the re-render, with the frame-lock error readout above

1 · Cockpit

The original beside the re-render

Each explanation's fitted path is drawn back through the reconstructed camera, so you can hold the prediction against the real frame. Difference and Blink show what the re-render does not explain. Over GIMBAL the predicted horizon sits a median 2.5 pixels from the measured one.

Data: the official NAVAIR copies of the videos (2020 FOIA release), hashed; every frame extracted.

2 · God's-eye

The jet's turn and the fan of sight lines

The jet's path comes from its own instruments: air speed, altitude and bank turned into a turn (for GIMBAL, refined by the motion of the clouds), with the wind from the ERA5 weather reanalysis. From it fans the pod's line of sight, one per frame. Each explanation's path for the object rides those lines; slide the range and watch them move.

Data: on-screen speed, altitude and bank per frame; ERA5 winds and temperatures (Copernicus), checked against radiosonde soundings (NOAA IGRA).

3 · Range explorer

When there is no range, the answer is a curve

GIMBAL and FLIR1 show no distance to the object, so the same image fits a small thing close by or a big thing far away. For every assumed range, the lab shows how fast, how high and how hard-turning each explanation's object would have to be, against balloons, birds, airliners, Mach 1 and a fighter's 9 g. A single radar range would pick one point on every curve at once.

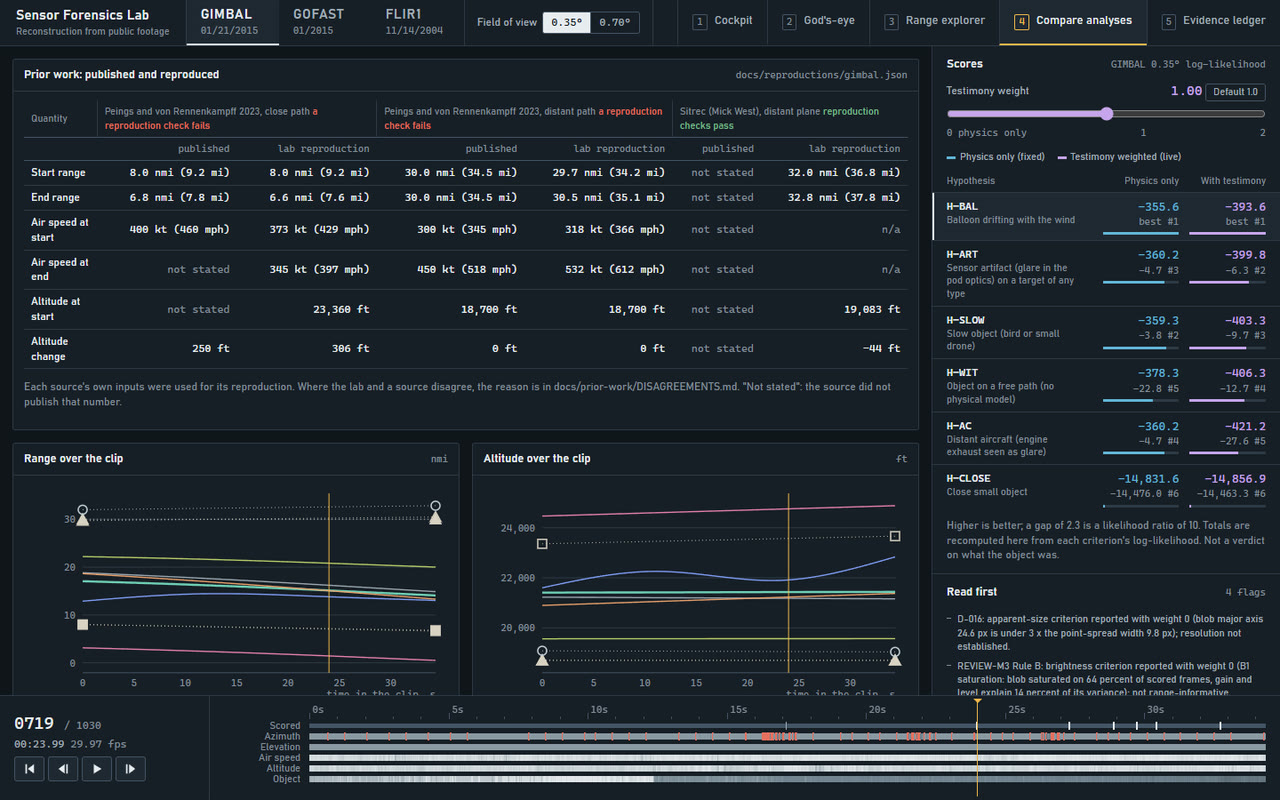
Compare analyses view: published values beside the lab's reproductions of Peings and von Rennenkampff 2023 and Sitrec

4 · Compare analyses

Prior work, rerun from its own inputs

Before scoring anything, the lab reproduced earlier analyses. Mick West's Sitrec reproduces for GOFAST and GIMBAL, and the lab's port of its pod geometry gives Sitrec's own locked GIMBAL test value. The 2023 GIMBAL flight paths of Peings and von Rennenkampff reproduce only in part, and every difference is traced to an input.

Sources: Sitrec (MIT licence); Peings and von Rennenkampff 2023 (arXiv 2306.08773); every disagreement in DISAGREEMENTS.md.

5 · Evidence ledger

Every reading, and every weight

9,279 readings off the GIMBAL screen alone, each with its frame, method and confidence; click one to jump to its frame. 160 sourced witness claims sit beside them, paraphrased with source and timestamp. Drag the weights and the scores recompute live; the physics-only total is always shown next to the one that counts testimony.

What it found

No Navy video has a decisive winner. A lead only counts as decisive here if it is 10 times more likely or better and survives three checks: a refit without the lab's after-the-fact data-quality rules, the rotation noise halved or doubled, and the model-recovery test. None does, and each case comes down to one missing measurement.

GIMBAL frame with the re-render

GIMBAL January 2015

A balloon-like drifter leads by small margins; drop two data-quality rules and the free-path object leads instead, so both rankings are shown everywhere. At the documented 0.35° field of view, every leading physical explanation puts the object 15 nmi or more away by the end, while the aircrew report 6 to 8.

Would settle itA radar range good to about 2 nmi.

GOFAST January 2015

The range is on screen, 4.4 down to 3.3 nmi, which puts the object near 13,200 ft. A balloon, a slow flier and a glare on a slow target all fit the same path, and this data cannot tell them apart.

Would settle itAn independent wind at 13,200 ft, good to about 4 kt, separates some of them.

FLIR1 "Tic Tac" November 2004

The result hangs on one number, the noise in the shape's measured rotation. At the value measured from the video, 11.86°, the free-path object leads; allow 12.75° or more and a glare in the pod's optics leads instead.

Would settle itA radar closure rate near the end, good to about 17 kt.

PURSUE 2026 release

All 134 sensor videos released in 2026 were triaged. None can be fully rebuilt: no clip shows the pod's azimuth. Sixteen carry some scale, and the eight strongest give bounded size and speed. The "23M"-style tracker labels turn out to be the box width in metres, not a range; the 2026 paper's speed bound for PR149 reproduces; PR113's scale is a pitch ladder.

  • 0full
  • 16bounded
  • 118not viable

How it's checked

Every number in the lab is read off the frame or computed from cited data, and every step was checked by something other than the code that made it.

The whole-degree readouts are treated as intervals, not exact values; frames that move together are counted as fewer independent samples; and the data-quality rules chosen after seeing results are flagged, with every total shown both with and without them.

How it was made

Read the frame

The work began with an audit: what each video shows on screen, frame by frame, and how far it can be rebuilt. A template matcher then read every character of the symbology with a confidence score, a second OCR engine voted, and a correction tool handled the hard frames.

Rebuild the geometry

A spherical-Earth model, the ATFLIR pod's gimbal geometry ported from Sitrec v1, the jet's turn from its bank, speed and the drifting clouds, and real winds. Prior analyses were rerun from their inputs before any explanation was scored, so differences could be traced.

Score, then show

One scoring path for all six explanations, with interval likelihoods, a penalty for free parameters, and a sweep of the rotation noise that FLIR1's result hangs on. The browser lab (three.js, no framework) shows it frame-locked to the footage; this page's clips were filmed from it by a script.

Designed and directed by Stewart Gregerson; built with Claude Code (Opus 5.5) over four days, in seven checked milestones. Python 3.12, NumPy, SciPy and OpenCV for the analysis; the cases are exported in an open case-file format with their sources and hashes.

Step through it frame by frame.

Open the lab Source on GitHub See my other projects